
To Issue 160
Citation: Foerster L, Peissig D, “Challenges in Testing the Accuracy of Infusion Pump Doses”. ONdrugDelivery, Issue 160 (May 2024), pp 58–62.
Lucas Foerster and Dieter Peissig explore the critical factors in choosing the right balance for infusion pump performance validation and discuss potential sources of error.
Precision in medical device technology is not just a goal – it is a necessity. Infusion pumps, which are integral to delivering life-saving treatments, must always operate with the utmost accuracy, as even the slightest deviation can have profound consequences. As these devices become more advanced, achieving precision levels as low as 0.01 mL/h, the margin for error narrows, particularly in sensitive applications such as neonatal care.
“Generally, balance drift only has a significant influence on flow rate measurement results at dosing rates of less than 10 mL/h.”
To safeguard against these risks, infusion pumps are subjected to stringent testing protocols. Gravimetric assessments, as outlined in standards such as IEC 60601-2-24 and technical reports such as AAMI TIR-101, are a cornerstone of this process. However, these tests present unique challenges, especially when it comes to the balance’s ability to detect minute changes at low flow rates and to respond swiftly at higher ones.
When choosing the right balance for pump performance validation, there are a number of critical factors to consider. It is also important to understand the potential sources of error that can impact measurement results when using a test set-up in accordance with IEC 60601-2-24 (Figure 1) or AAMI TIR-101. In collaboration with B. Braun Melsungen, Sartorius has gleaned insights into how to minimise these errors, ensure reliable flow rate checks and, ultimately, enhance patient safety.
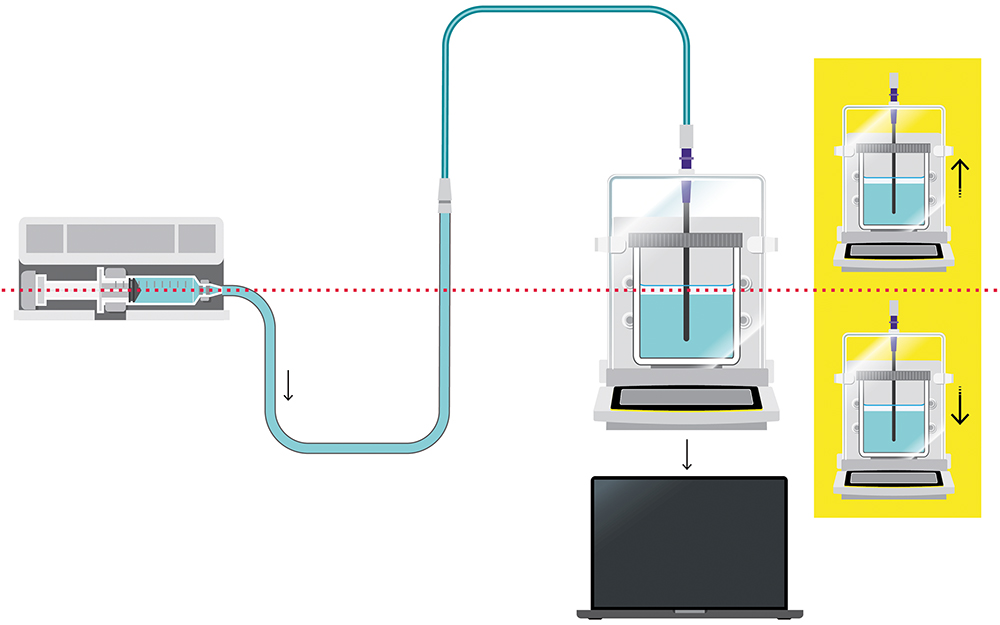
Figure 1: Set-up structure according to IEC 60601-2-24.
WHICH BALANCE?
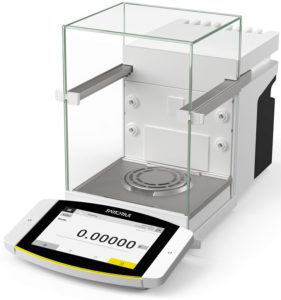
Figure 2: Cubis® II high-capacity microbalance. Aligned with AAMI TIR101 for tests with flowrates < 0.1 mL/h.
Choosing the right balance is crucial for validating pump performance while meeting IEC 60601-2-24 and AAMI TIR101 standards. Three key factors to consider are:
- Readability/Resolution: This refers to the smallest measurable graduation on the balance’s scale. It indicates accuracy and the ability to detect small weight differences. Different types of balance offer varying levels of precision, from precision balances (1 mg) to microbalances (0.001 mg). TIR101 provides resolution recommendations for different flow rates.
- Capacity: This indicates the maximum weight a balance can accurately record. It is important for maintaining precision and avoiding damage. Higher capacities are recommended for testing infusion and syringe pumps, enabling longer test durations without frequent emptying.
- Linearity Deviation: This measures how accurately values align along a straight line across a weight range, indicating consistency and precision. Smaller deviations indicate better accuracy in maintaining proportionality between displayed and measured weights.
The balances recommended by Sartorius, according to AAMI TIR101, can be found in Table 1. For flow rates below 0.1 mL/h it recommends the high-capacity microbalance MCA66S (Figure 2) with a capacity of 61 g and a resolution of 1 μg.
| Measurement Parameter and Range |
Balance Interval (g) |
Recommended Cubis® II Balance |
| Balance (nominal capacity > 1000 mL/h) |
0.001 | Precision balance MCA5203S or MCA14202S (0.01 g) |
| Balance (nominal capacity 10 mL/h to 1000 mL/h) |
0.0001 | Analytical balance MCA524S |
| Balance (nominal capacity 0.1 mL/h to 10 mL/h) |
0.00001 | Ultra-high-resolution semi-microbalance MCA225S |
| Balance (nominal capacity < 0.1 mL/h) |
0.000001 | Ultra-high-resolution microbalance MCA66S |
Table 1: Recommended resolution according to AAMI TIR101.
SOURCES OF ERROR
This section looks at potential sources of error on the measurement side. The following possible sources of error are examined:
- Balance drift
- Temperature change
- Relative humidity change
- Dynamic weighing
- Displacement of the cannula in the sample solution
- Electrostatic.
The various sources of error are interpreted in order to clarify how each effect can be minimised or understood so that a reliable result can be obtained in the flow-rate check.
“The greatest influence on balance drift can be minimised by maintaining a constant room climate (including humidity and temperature).”
Balance Drift
Temperature and humidity changes can cause balance drift, an unwanted change in weight value without additional dosing. This phenomenon is influenced by environmental factors, with temperature fluctuations playing a significant role. Vibrations may also contribute to balance drift.
It has been observed that, generally, balance drift only has a significant influence on flow rate measurement results at dosing rates of less than 10 mL/h. B. Braun Melsungen has intensively studied the balance drift of semi-microbalances (resolution of 0.01 mg). Nine semi microbalances were used for the study, which recorded a measured value every 30 seconds over a period of 40 hours. A weight of 135 g was used as a preload.
The results were plotted by showing the change in weight in mg on the Y-axis against time on the X-axis (Figure 3). It was noticeable that the curves on the different balances were remarkably similar (maximum change of 0.4 mg, equivalent to 40 digits), indicating that external influences were responsible for the observed changes and they were not generated by individual balances.
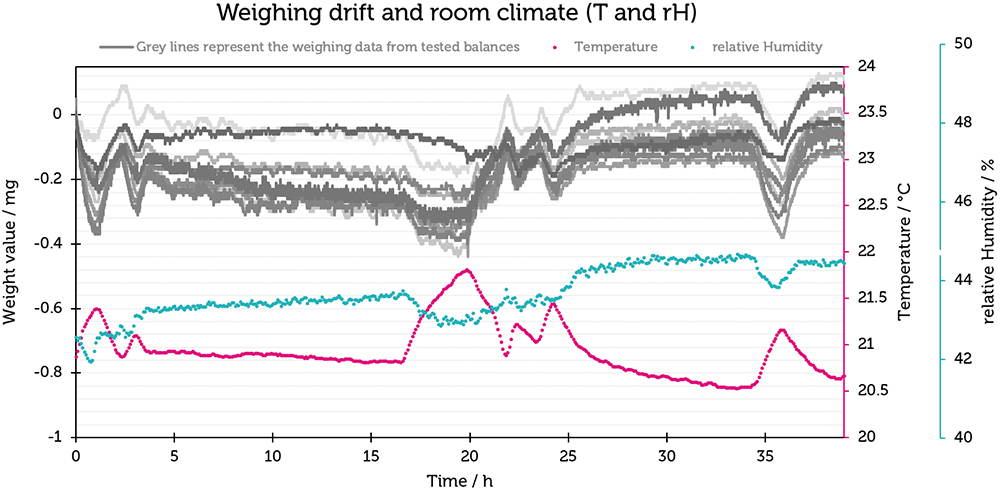
Figure 3: Plot of weighing drift (mg) and relative humidity (%rH) against time (h) for the Cubis® semi-microbalances.
To quantify the relationship between the weighing drift and the flow-rate determination, the measured values, which contained measurement errors resulting from the weighing drift, were converted to a flow rate of 1 mL/h. The results are shown in Figure 4 and illustrate that the influence of the balance drift in this particular case resulted in an error of 0.8±0.4%, which indicates that the balance drift plays a subordinate role in the measurement of flow rates.
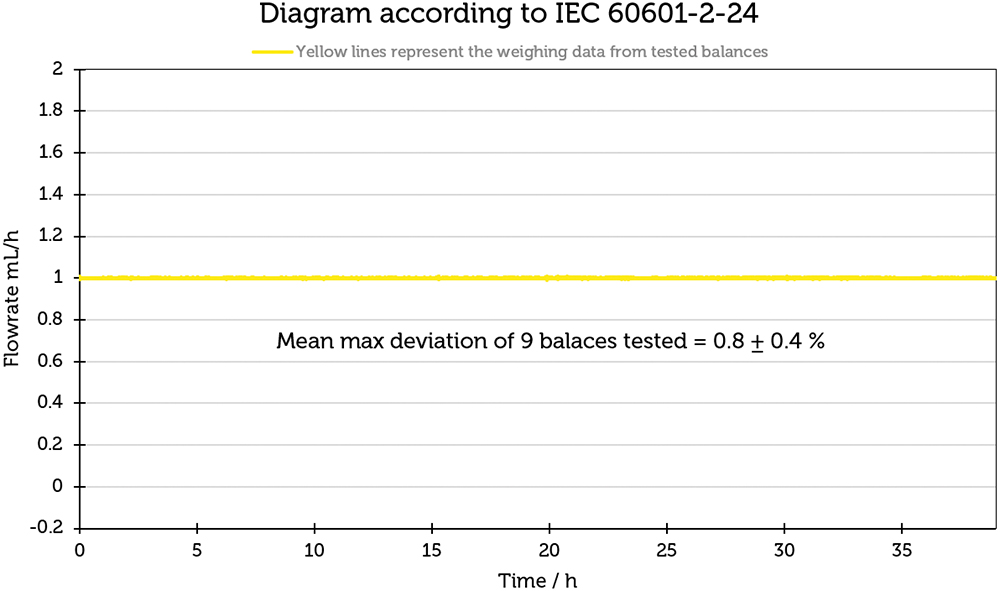
Figure 4: Influence of the weighing drift on a flow rate of 1 mL/h.
To investigate their correlation, the information from the indoor climate recording was linked to the weighing data in diagrams. First, room humidity was looked at. A direct correlation can be seen here – the measured weight value increases with increasing humidity.
Temperature is also shown in Figure 3. Interestingly, there is an opposite effect compared with humidity – as the temperature increases, the weight value decreases, and vice versa. The effect of temperature change plays a much greater role than humidity.
In summary, the greatest influence on balance drift can be minimised by maintaining a constant room climate (including humidity and temperature). In addition, it is advisable to use the balance close to its optimum working range and to avoid exposure to vibrations in the vicinity of the balances.
Beyond that, the effect of balance drift (0.8±0.4%) could be illustrated. Under stable temperature and humidity, the influence of balance drift is minimal. It is important to emphasise that the Cubis® and Cubis® II balances have a monolithic weighing system, which reduces the scale drift to a minimum compared with conventional weighing systems with hundreds of individual parts.
Quality of the Cubis® Balances in the Dynamic Weighing Range
To better understand the quality of measurement results from the Sartorius Cubis® semi-microbalance in the dynamic weighing range, B. Braun Melsungen carried out a test run with a high-precision pulsation-free pump (Cetoni Nemesyspump), a precision syringe (Hamilton glass syringe) and the Sartorius semi microbalance, referred to as Set-up 1 (Table 2).
| Set-up 1 | Set-up 2 |
| Cetoni Nemesys syringe pump | |
| Hamilton glass syringe | Disposable plastic syringe |
| Sartorius Cubis® semi-microbalance | |
Table 2: Explanation of the different set-ups.
The results of this test should show that a Sartorius Cubis® semi-microbalance can fulfil the required accuracy according to ISO 7886-2 and IEC 60601-2-24. In addition, the Hamilton syringe was replaced with a disposable plastic syringe in a second experiment (Set-up 2) in order to check to which extent the accessories of the measurement set-up could contribute to a measurement error.
| Evaluation | Set-up 1 | Set-up 2 |
| Mean value | 0.99 mL/h | 0.96 mL/h |
| Standard deviation | ±0.02 mL/h | ±0.32 mL/h |
Table 3: Mean value and standard deviation of the flow rate of Set-up 1 and Set-up 2.
Figure 5 shows the flow-rate curves for Set-up 1 in blue and for Set-up 2 in magenta. The flow rate curve for set-up 1 is notably consistent around 1 mL/h. The average value over 100 minutes is 0.99±0.02 mL/h (Table 3). The results confirm the balance’s precision, even with dynamic weight changes. Conversely, the flow-rate curve for Set-up 2 exhibits greater deviations from the target flow rate of 1 mL/h. The mean value over 100 minutes for this set-up is 0.96±0.32 mL/h, reflecting the influence of different syringe materials on the flow-rate accuracy.
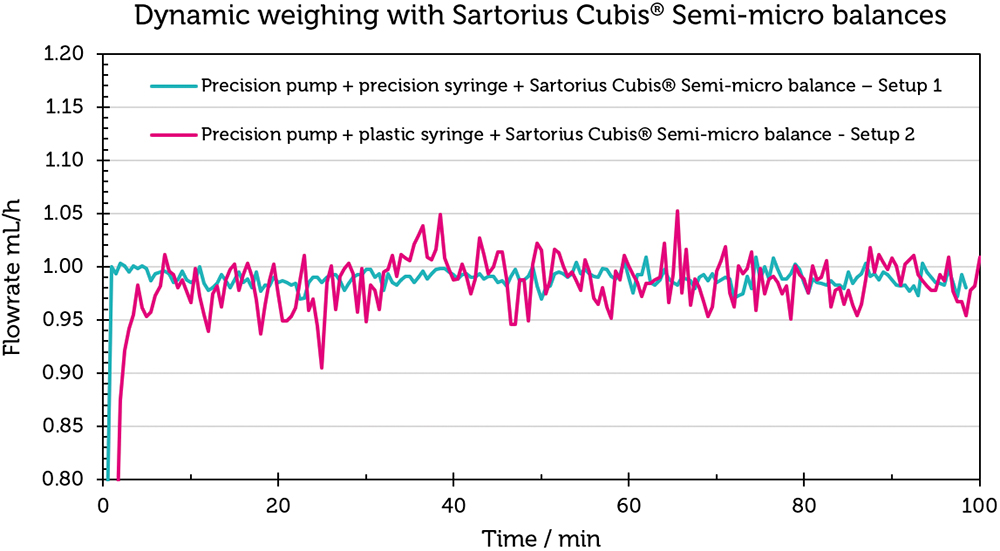
Figure 5: Checking the stability of a Sartorius Cubis® semi-microbalance using Set-up 1 and Set-up 2. The scale of the y-axis is not norm conform, since it has a higher resolution to demonstrate the effect on the balance.
The experiment demonstrates that the Sartorius Cubis® balances are capable of accurately reproducing measured values in scenarios involving dynamic weight change, as well as in flow-rate checks as required by IEC 60601-2-24. It also highlights that deviations from the ideal flow rate are influenced by the ancillary equipment used in the measurement set-up.
Electrostatics
Electrostatic forces can significantly influence the accuracy of flow-rate measurements. When using glass or plastic beakers on a balance, electrostatic charges may accumulate within the weighing chamber. These charges can cause the balance to experience drift due to the attraction or repulsion between the beaker and its surroundings.
The Cubis® II balances address this issue effectively with an integrated ioniser, which neutralises electrostatic charges on all samples and beakers within the weighing chamber, ensuring precise measurements.
Displacement Through Cannula
One factor that should not be underestimated is the change in weight caused by the change in liquid level. As the liquid rises, the cannula is also immersed deeper and therefore has an influence on the weight value. In an experiment, it has been shown that the immersion of the cannula has led to a mass change of up to 0.264 g. There are various ways to calculate the effect of cannula constriction. One (mathematical) is discussed here and one (experimental) is shown in the Sartorius dose accuracy application note.1 In the mathematical approach, the buoyancy correction (δmbuoy) is calculated using the final mass (IL), the initial mass (IE), the diameter of the immersed cannula and the diameter of the vessel used.
The experiment in the dose accuracy application note clearly shows that it makes sense not to neglect the displacement of the cannula in order to generate reproducible and valid measured values.
View the dose accuracy application note, here.
SUMMARY
In the previous sections, various parameters were considered in detail, including temperature, weighing drift, electrostatics, cannula displacement, humidity and measurement interval (with an interval between readings of 30 seconds according to IEC 60601-2-24 and 10 seconds according to AAMI TIR-101).
B. Braun Melsungen provided an overview of the influence of various parameters on the different test characteristics, such as:
- Flow rate (< 1 mL/h)
- Flow rate (> 10 mL/h)
- Start-up curve
- Long-term measurement (> 6 h)1
- Mean percentage error (A).1
CONCLUSION
The combination of a particularly high resolution (up to 1 μg) together with a high maximum capacity and the monolithic weighing system make the Cubis® II balances the ideal test equipment for determining the dosing rates in accordance with IEC 60601-2-24 and TIR 101, in addition to numerous important advantages, such as the built-in ioniser and the electrically conductive draft shield.
With the help of B. Braun Melsungen’s measurement results, it was possible to show that influencing factors such as temperature and relative humidity have a marginal effect on the result of the dosing rate. In addition, a high-precision test set-up (Figure 5) could be used to determine that the Cubis® II semi-microbalances meet the quality requirements of IEC 60601-2-24 and ISO 7886-2.
The collection of data helped to optimise the Cubis® II balances for this application in order to generate fast and reliable measured values with this dynamic weighing value change. As a result of the experience gained in this application, Sartorius is able to respond quickly and competently to the challenges of infusion and insulin pump manufacturers. This helps to make the testing of dosing pumps more reliable and safer – simplifying progress.
To find out more about Sartorius’ balances and other products for medical pump testing, visit: www.sartorius.com/en/applications/applied-industries/medical-devices/pump-testing-solutions.
REFERENCE
- “Challenges in Testing the Dose Accuracy of Medical Infusion Pumps”. Application Note, Sartorius, Apr 2024.