
Citation: Clayton J, Dattani R, Seaward D, “Choosing the Right Dosator for DPI Dosing”. ONdrugDelivery Magazine, Issue 85 (Apr 2018), pp 16-20.
Jamie Clayton, Rajeev Dattani and Dave Seaward discuss the operation of dosators for reliable and accurate filling of DPI capsules and blisters.
Most dry powder inhalers (DPIs) operate with pre-metered doses of drug formulation held in a capsule or blister pack. Dosator systems are routinely utilised for the production of these packaged doses because of their ability to deliver the requisite filling accuracy at a high throughput. However, DPI formulations often exhibit properties that make them difficult to dose precisely at the low volumes required, with poor flowability a recognised issue. Choosing dosing technology that is well-matched to the properties of the formulation therefore is essential for a reliable, efficient manufacturing pipeline.
“A free-flowing powder is required to fully fill the dosator tube but the powder must also be cohesive to prevent loss of the dose during transfer, compressing to a stable plug that that locks into the tube…”
In this article we examine the properties of DPI formulations and the conditions they are subjected to during dosator operation. The benefits of multi-faceted powder characterisation are discussed within the context of measuring powder properties for equipment selection and process optimisation. Experimental data highlight the ability of dynamic powder properties to provide a basis for dosator selection for a given DPI formulation.
DOSING DPI FORMULATIONS
To reach the lung, the particle size of the active pharmaceutical ingredient (API) in a DPI formulation must be in the region of five microns or less. Powders with particles in this size range usually are highly cohesive and have poor flow properties, making them difficult to process and disperse. Formulating the API with a relatively coarse carrier, such as lactose, is a well-established strategy for addressing these issues. Attaching the API to a more free-flowing carrier makes it much easier to dose, and the carrier is then stripped away during product use by the force of the patient’s inhalation, ending up deposited in the mouth and throat.
The pre-metered dose required for DPIs varies considerably, from less than one, to tens of milligrams, depending on the developed formulation. Dosator technology is routinely used for applications in the 10-600 mg range,1 with appropriate technology robustly delivering highly accurate DPI dosing at an acceptable throughput. Figure 1 shows a schematic of a dosator system.

Figure 1: Dosator systems are routinely used to pre-meter DPI formulation doses.
In operation, powder flows into the open end of the dosator tube as it is pushed into the loosely packed powder bed. The captured dose is lightly compressed by the dosator pin or piston, forming a compacted powder plug which is subsequently ejected into the receiving capsule or blister. The outlet of the dosator is typically matched to the packaging being used, with commercially produced dosators having fixed diameters to match standard capsule sizes. Dosing performance for a given dosator/powder combination, defined in terms of dose weight uniformity, is influenced by the magnitude of the applied compressive force, the initial height of the piston and the powder bed’s depth and consistency (i.e. the ease with which the powder bed flows and recovers following the removal of a dose).
“Though many techniques are available for powder flow measurement, including the relatively simple methods listed in USP 1174, few offer both the sensitivity needed for robust process optimisation and measure properties that reliably correlate with dosing performance…”
Because of the way in which they operate, dosators are more sensitive to the physical properties of the powder than alternative dispensing systems. A free-flowing powder is required to fill the dosator tube fully but the powder must also be cohesive to prevent loss of the dose during transfer, compressing to a stable plug that that locks into the tube. Dosators are therefore suited to only a limited range of powders.
Furthermore, for any given powder density and dosator diameter, the target weight can only be achieved by altering the depth of the powder plug. Varying the ratio of dosator diameter to plug depth can have a direct impact on dose weight uniformity, so this can be challenging with respect to achieving robust process performance. With a small diameter to plug depth, inconsistent dose weight is most likely to be due to incomplete or inconsistent filling of the dosator tube. Conversely, with a large diameter to plug depth, it may be associated with the powder failing to lock into the tube such that it falls out during transfer. Ensuring a good match between the properties of the powder and the selected dosator is essential.
USING A POWDER RHEOMETER FOR FORMULATION CHARACTERISATION
Useful measurement of powder flow properties, in the context of assessing dosator performance and compatibility, requires a technique that sensitively differentiates powders in a relevant way. As such, dynamic powder testing with a powder rheometer can be a productive choice for the optimisation of dosing technology (Box 1). Though many techniques are available for powder flow measurement, including the relatively simple methods listed in the US Pharmacopeia (USP 1174), few both offer the sensitivity needed for robust process optimisation and measure properties that reliably correlate with dosing performance.
With dynamic testing, powders are measured in motion. The resistance that a powder presents to flowing, quantified in terms of flow energy, is determined from precise measurements of the force and torque acting on a blade as it rotates along a prescribed path through a sample of known volume. This can be done under a range of conditions, with a sample that is consolidated, under moderate stress, aerated or even fluidised, to directly simulate a desired process.
The measurement of flow energy during a downward traverse of the blade yields the parameter Basic Flowability Energy (BFE). This rotation profile subjects the powder to forced flow conditions, pushing it down against the confining base of the test vessel. In contrast, an upward traverse of the blade exerts a gentle lifting action, generating the parameter Specific Energy (SE), which is indicative of how the powder will behave when flowing in low stress conditions, e.g. under gravity. The parameter Aerated Energy (AE) directly quantifies a powder’s response to air and is generated by measuring BFE as air flows upwards through the sample at a known velocity. Measuring AE as a function of air velocity makes it possible to compare how aeration impacts flowability, up to the point of fluidisation.
BOX 1: A PRAGMATIC APPROACH TO POWDER TESTING
Over the course of manufacture and use, a DPI formulation is likely to be subject to various significantly different conditions, which will alter the way the powder behaves. For example, when lightly compacted in a dosator the powder behaves as a stable plug whereas when aerated the powder behaves as an aerosolised cloud. Though it may not be clear from the outset which powder properties will correlate most closely with observed behaviour in either situation, it is reasonable to suggest that it will not necessarily be the same properties, highlighting the limitations of a single number approach.
In addition to generating dynamic powder properties, powder rheometers can assess shear and bulk powder properties – compressibility, permeability and bulk density. These instruments can therefore be used to generate a database of properties for any given powder. Correlating these properties with performance data highlights those of most relevance for any given process. Such correlations make it possible to develop a specification characterising powders that will process well, therefore supporting the development of a robust design space and/or optimised formulation.
The case study here highlights the relevance of SE and AE in determining metering performance, and previous studies2 have also identified a direct correlation between fine-particle dose, the dose delivered by a DPI that lies in the sub-five micron region, and AE. These findings underline the value of being able to measure multiple powder properties and the broad relevance of dynamic data to both manufacturing (dosing) and product performance (dispersion and drug delivery).

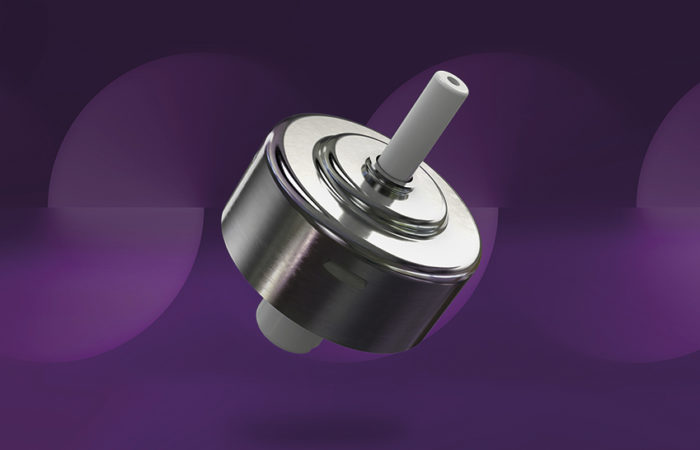
Figure 2: A lab-scale dosator is a useful tool for experimental investigations and confirmation of an optimal configuration for a given formulation.
CASE STUDY: CORRELATING DYNAMIC POWDER FLOW PROPERTIES WITH DOSATOR PERFORMANCE
Five lactose powders, with varying particle size distributions, were processed through a lab-scale dosator (Figure 2) using outlets of progressively decreasing size, from Dosator 1 to Dosator 4, whilst keeping all other process conditions constant. The goal was to produce doses of 50 mg consistently with a relative standard deviation (RSD) of <2%. The results of the trial in terms of RSD values for each lactose-dosator combination are shown in Table 1. The results demonstrate that this type of analysis helps optimise dosator geometry for a given powder.
| D50 Particle Size Range (µm) | Dosator 1 | Dosator 2 | Dosator 3 | Dosator 4 | |
| Lactose 1 | 180-250 | 2.27 | 2.40 | 2.06 | 0.89 |
| Lactose 2 | 110-155 | 3.77 | 1.54 | 1.00 | 1.08 |
| Lactose 3 | 70-110 | 1.84 | 0.85 | 0.79 | 0.56 |
| Lactose 4 | 40-70 | 1.34 | 2.02 | 2.13 | 4.41 |
| Lactose 5 | 4-11 | 3.76 | 7.05 | 7.59 | 8.32 |
Powder Characterisation
Using a powder rheometer, a range of dynamic, shear and bulk powder properties were measured for each of the lactose samples in order to determine a rationalisation for the observed trends in dosator performance. Dynamic powder properties, particularly AE and SE, were found to correlate most strongly with dosator performance.
| AE2 (mJ) | |
| Lactose 1 | 2395 (±7.0%) |
| Lactose 2 | 1500 (±1.7%) |
| Lactose 3 | 725 (±6.1%) |
| Lactose 4 | 180 (±3.5%) |
| Lactose 5 | 410 (±5.6%) |

Figure 3: Plots of AE as a function of air velocity indicate that the lactose samples vary significantly in terms of their response to air.
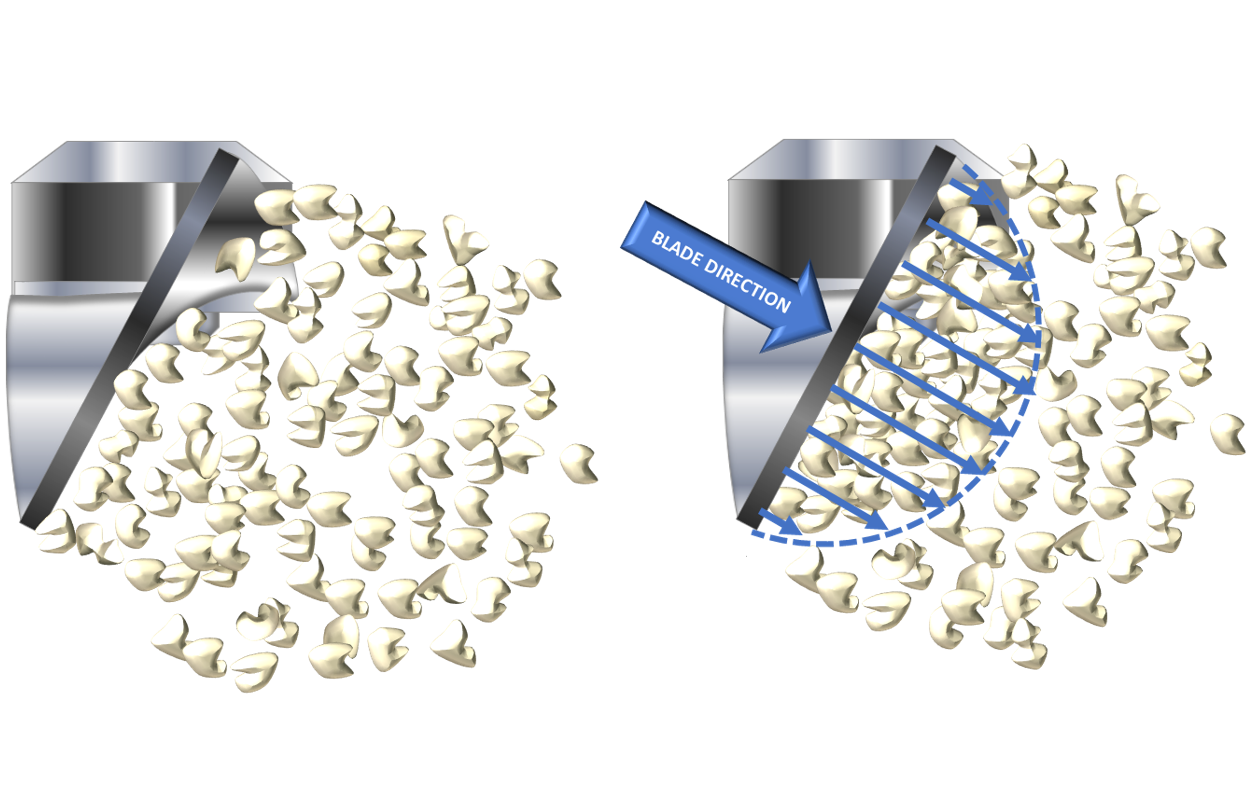
Very fine, cohesive powders with high interparticular forces, tend to have a relatively low flow energy because of their ability to entrain and retain air. Entrained air dampens the transmission of shear through the powder bed, thereby reducing the energy needed to move the powder, as seen in Figure 4. The introduction of air tends to have little effect on such powders because the upward flowing air cannot easily break the strong interparticular forces of attraction. Lactose 5 exemplifies this behaviour. It has a low flow energy that is minimally impacted by air velocities of up to 10 mm/s.

Figure 4: The air entrained in a cohesive powder (upper image) dampens the shear transmission zone giving rise to low BFE values relative to those for powders with larger particles and lower interparticular forces of attraction (lower image) in which shear is transmitted far more effectively.
When interparticular forces of attraction are lower, as is the case with larger particles, air flowing through the powder bed can separate and lubricate individual particles, easing their movement relative to one another. However, Figure 4 also demonstrates that lower interparticular forces reduce the ability of the powder to entrain air. Such powders therefore have a relatively high flow energy that decreases significantly with aeration. Lactose 2, 3 and 4 all display this characteristic.
“Correlating dynamic properties with dose consistency makes it possible to predict more optimal dosator configurations for given powders…”
In powders with sufficiently coarse/regular particles a third pattern of behaviour emerges, associated with highly uniform packing within the powder bed. Stress is transmitted extremely efficiently in such powders giving rise to a high flow energy. However, as a result of low interparticular forces and high permeability, any air introduced flows freely through the bed with little to no impact on the particle packing structure. High air velocities are therefore needed to separate the larger, denser particles. These effects are clearly evident in Lactose 1, but also help to rationalise the trend in AE2 observed in Lactose 2 through to Lactose 4.
Figure 5 shows SE values for the five lactose samples. In an SE measurement the powder is unconfined and the movement of particles, relative to one another, therefore tends to be highly influenced by interparticular friction and mechanical interlocking. Particles that are irregularly shaped and/or have a rough surface move less easily with respect to each other and may lock together, resulting in higher SE values. Lower SE values are usually associated with smooth, regularly shaped particles. Here the finest lactose, Lactose 5 exhibits the highest SE, while the two coarsest lactose samples, Lactose 1 and 2 have similarly low values.

Figure 5: SE values for the five lactose samples indicate that they vary significantly in terms of interparticular friction and mechanical interlocking.
Rationalising Dosator Performance
Correlating dynamic properties with dose consistency makes it possible to predict more optimal dosator configurations for given powders. With the largest dosator outlet, Dosator 1, Lactose 3 and Lactose 4 are the only samples to deliver acceptable performance. These powders have a relatively low AE2 coupled with a low to mid-range SE. Lactose 5, also has a low AE2, but its SE value is high, indicating greater mechanical interaction. Dosator 1 appears to be optimally suited to powders that combine a low AE2 with a moderately low SE.
Dosators 2 and 3 deliver acceptable performance for Lactose 2 and 3, and near-acceptable performance for Lactose 1 and 4. Lactose 2 and 3 exhibit similar low SE values and a similar AE profile. Lactose 1 has a similar SE but a much higher AE2, whilst the poorer performance of Lactose 4 can be attributed to its relatively high SE value. These outlets appear to require a powder with a lower SE than Dosator 1 but can tolerate a higher AE2.
Lactose 1, 2 and 3 all exhibit acceptable performance in the smallest dosator outlet while Lactose 4 and 5 perform relatively poorly. In this case performance appears to be heavily influenced by SE, which is similar and low for Lactose 1, 2 and 3. There is minimal correlation with AE2. The inferior performance of Lactose 4 and 5 can be directly attributed to higher SE values.
These results indicate that powders that combine a low SE with a low AE2 perform best in all configurations. However, as the outlet size of the dosator decreases, AE2 becomes a less influential factor and sensitivity to SE increases. A larger dosator allows for a greater interaction with air at the outlet, thus reducing the impact of interparticular interactions. This is reflected in a stronger correlation with AE2. With smaller outlets, there is little opportunity for interaction with air and the physical interactions that define SE dominate performance.
CONCLUSION
Different DPI formulations are optimally processed with different dosing technology, with the flow properties of the formulation influencing equipment choice and performance. When considering a dosator system, how easily the formulation flows directly impacts filling of the dosator tube and, by extension, dose weight uniformity. The case study described here illustrates how dynamic flow testing with a powder rheometer generates data that can be used to scope and rationalise dosator performance. In this way dynamic testing can support the development of more easily processed DPI formulations and the selection of equipment that will securely deliver a consistent pre-metered dose.
REFERENCES
- Podczeck F and Jones BE “Pharmaceutical Capsules” Second Edition, Published Feb 2004.
- Shur J, Price R, and Freeman T, “Fine Tuning DPI Formulas” Manufacturing Chemist, June 2008.