
Citation: Copley M, “Variability in Cascade Impaction: Sources, Impact and Strategies for Reduction”. ONdrugDelivery Magazine, Issue 92 (Nov 2018), pp 60-65.
Mark Copley considers cascade impaction as a method for determining the aerodynamic particle size distribution of orally inhaled drug products, and how techniques to improve air flow control and semi-automation of the process can significantly reduce the variability involved.
The pivotal role of cascade impaction in inhaled product development and manufacture drives ongoing efforts to reduce the variability associated with its use. The delivered particle size of an inhaled drug influences deposition behaviour within the lung and clinical efficacy, making it a critical quality attribute for all orally inhaled products (OIPs). Cascade impaction delivers aerodynamic particle size distribution (APSD) measurements specifically for the active pharmaceutical ingredients (APIs) within a formulation but is a lengthy, predominantly manual technique, prone to variability.
“This comparison underlines the critical point that there is no single cascade impactor set-up or method used in inhaler testing. Variability reduction is a unique task for each application…”
Understanding how cascade impaction works and how to mitigate variability ensures that measured data are robustly fit for purpose. Out-of-specification (OOS) results compromise efficiency and profitability, necessitating repeat testing which reduces productivity and lowers morale. More fundamentally, they make it difficult to identify product variability robustly, eroding a company’s ability to safeguard clinical efficacy or progress product development. This article considers the sources and impact of variability highlighting technology that is useful in minimising OOS results, some of which is additionally helpful in delivered dose uniformity (DDU) testing.
INTRODUCING CASCADE IMPACTION
Cascade impactors separate a sample by particle inertia, which is a function of particle size and velocity. During testing, sample laden air is drawn through the stages of the impactor at a constant volumetric flow rate by a vacuum pump (Figure 1). Each stage consists of a plate with a defined nozzle arrangement and a collection surface, with both nozzle size and total nozzle area decreasing with stage number. At each stage, progressively smaller particles acquire sufficient inertia to break free of the prevailing air flow and impact on the collection surface.

Figure 1: As sample is drawn through the stages of a cascade impactor (a), progressively smaller particles acquire sufficient inertia to break free of the prevailing air flow and impact on the associated collection surface (b). At any given flow rate each stage therefore has a defined cut-off diameter, the D50 of the collection efficiency curve (c).
Separation depends on impactor design but for each stage is typically defined by a steep curve (Figure 1). Stage cut-off diameter is the median diameter (D50) from this curve and dependent on:
- Nozzle diameter which is maintained by, for example, regular cleaning and periodic stage mensuration
- Nozzle-to-collection surface distance, although this is of secondary importance
- The flow rate of air through the impactor.
Residual fines are collected on a filter/micro-orifice collector (MOC) and measurement is then completed by rigorous drug recovery from each collection surface, the mouthpiece adapter, induction port, final filter/MOC and pre-separator (where used). The resulting samples are analysed, typically by high performance liquid chromatography (HPLC), to determine APSD data specifically for the drug or drugs, in the case of multi-component formulations.
THE PRACTICALITIES OF TESTING
In an APSD measurement set-up the cascade impactor, most usually the Andersen Cascade Impactor (ACI) or Next Generation Impactor (NGI), is used with ancillaries that:
- Maintain a constant, accurately known volumetric air flow rate at the impactor inlet
- Interface the OIP with the inlet (induction port)
- Apply relevant conditions to the OIP during testing.
The apparatus selected depends on the OIP and the purpose of testing. For example, compare an optimal test set-up for quality control (QC) for a metered dose inhaler (MDI) with one tailored more closely to dry powder inhaler (DPI) product development. In QC, the purpose of testing is to detect difference and the test methods and equipment defined in the pharmacopeias1,2 are usually applied (Figure 2a).

Figure 2: Test set-ups for APSD measurement depend on the purpose of testing such as: a simple ACI set-up for QC for MDIs (a), or an NGI set up for enhanced IVIVCs for DPIs (b).
In contrast, in drug development there is considerable value in maximising the clinical relevance of in vitro test data, to reduce requirements for more time-consuming and expensive in vivo testing and to accelerate progress. The test set-up shown for DPIs (Figure 2b) provides better IVIVCs (in vitro/in vivo correlations) by incorporating a:
“The impact of variability is either a failure to achieve mass balance, meaning not all of the dose is sized, or an erroneous APSD, meaning the dose is sized incorrectly…”
- More anatomically correct OIP-impactor interface – the Alberta Idealised Throat (Copley Scientific, UK) which generates more clinically realistic throat deposition data than the European/ US pharmacopoeias’ standard induction port.3,4
- Breathing simulator to apply a patient-representative breath profile to the OIP, during testing.
- Mixing inlet to decouple the flow through the impactor from the flow through the OIP, allowing the maintenance of a constant air flow rate through the impactor.
This comparison underlines the critical point that there is no single cascade impactor set-up or method used in inhaler testing. Variability reduction is a unique task for each application.
SOURCES OF VARIABILITY AND THEIR IMPACT
There has been significant investigation of the potential sources of variability in cascade impaction (notably a study conducted via the Product Quality Research Institute (PQRI), see Figure 3), which can be helpfully classified as associated with the:
- MANual nature of the analysis
- test apparatus (MACHINE)
- MEASUREMENT method
- product itself (MATERIAL).
This work (Figure 3) provides a foundation for the implementation of good cascade impactor practice (GCIP), the idea that the risk of inaccurate or imprecise CI measurements can be minimised by systematically identifying and controlling all associated sources of variability.5

Figure 3: The complexity and manual nature of cascade impaction means that that are many potential sources of variability.5
Scrutiny of this list highlights the breadth of factors that must be considered to ensure robustly reproducible APSD measurement, including certain subtle issues unique to the performance of impactors and OIPs such as the:
- Potential impact of the test environment. Temperature and humidity (especially in the case of hygroscopic formulations) may affect an OIP active and must be carefully considered during method development. In addition, for nebulisers, the temperature, or more specifically the thermal mass of the impactor, is a specific issue which can lead to evaporation and the under-sizing of droplets, especially for solution-based products. Impactor cooling, typically to a temperature of around 5ºC, is common practice and facilitated by purpose-built accessories such as the NGI Cooler (Copley Scientific, UK).6,7
- Influence of electrostatics on particle behaviour within the impactor, which can be exacerbated by low humidity environments. This can cause deposition on the wrong stage or, indeed, between stages, impacting the mass balance. Equipment grounding and the use of static eliminators and metal rather than plastic induction ports/throat models (where adopted)8 can all be helpful precautions.
- Collection of particles on the wrong stage due to particle bounce and re-entrainment. This is most likely with DPIs and can be resolved by collection surface coating with a thin layer of a viscous or sticky material, such as silicone oil or glycerol.
The impact of variability is either a failure to achieve mass balance, meaning not all of the dose is sized, or an erroneous APSD, meaning the dose is sized incorrectly. Criteria for mass balance acceptance include those in the European Pharmacopoeia (EP)2 which specifies that the total mass of API recovered should lie within 75–125% of the average delivered dose, whereas the US Pharmacopeia (USP) and FDA recommend that the mean amount of API recovered should lie between 85–115% of the label claim on a per actuation basis.1,9 Ensuring the accuracy of APSD values is more difficult and relies heavily on robust method development.
FOCUSING ON FLOW
Maintaining a constant, accurately determined air flow rate through the cascade impactor is essential for precise APSD measurement, making flow control a primary focus for variability reduction. The pharmacopoeias1,2 specify that test flow rate should lie within ±5% of the target flow, taking into account errors associated with determining and setting flow, which equates (via Stokes Law) to a variance in stage cut-off diameter of approximately ±2.5%.
Nebulisers and MDIs are both tested at a standard test flow rate of 15 L/min and 28.3 L/min respectively (30 L/min for the NGI, which is calibrated at this flow rate).1,2,6,7 For DPIs, testing is carried out at the flow rate that results in a 4 kPa pressure drop across the OIP, reflecting the pressure drop generated by a typical adult patient during product use, up to limit of 100 L/min. A total test volume is also specified for DPIs: 4 L per simulated inhalation (2 L for DDU in USP/FDA guidelines). In combination with test flow rate, this defines a square-wave profile that is used for both APSD measurement and DDU testing. To enhance flow stability, the pharmacopoeias also specify that, when testing DPIs, the pressure downstream of the flow control valve, P3, should be less than 50% of the upstream pressure, P2. This imposes sonic flow conditions across the valve, minimising the impact of vacuum pump derived fluctuations in pressure downstream of the valve (Figure 4) and flow resistance changes when switching between OIP and flow meter at the inlet.

Figure 4: For all OIPs, test flow rate can be determined by replacing the OIP with a flow meter and adjusting the flow control valve. Critical flow across this valve (P3/P2 ratio ≤0.5) is an additional requirement for DPIs, which are most easily set-up using a critical flow controller.
For all OIPs, examples of good practice associated with setting up and maintaining the required flow rate through the impactor include10:
- Regular leak testing of the impactor, since flow entering by any route other than the inlet will impact data integrity.
- Regular calibration of the flow meter, ideally for exiting flow rate, since this is the entry flow rate to the impactor, though exiting flow rates can be calculated from calibrated inlet air flows when the pressure drop over the flow meter is known.
- Applying suitable correction factors to account for any differences in temperature and pressure between calibration and experimental conditions.
Technology that can be particularly helpful in this area includes the TPK™ 2100 Critical Flow Controller (Copley Scientific, UK), which automates the more complex test set-up associated with DPIs, controlling and documenting all the associated parameters for both DDU testing and APSD measurement. Using an automated flow control valve, this accessory rapidly sets both inhaler pressure drop and test flow rate. An automatic user alert to loss of sonic flow conditions, notification of any failure to meet the acceptance limits associated with set flow rate and leak rate, and the capacity for fully automated leak testing further support rigorous flow control and variability reduction.
Co-ordination – exploring MDI Performance
While drug delivery with a DPI is triggered and driven by the inhalation manoeuvre of the patient, MDIs provide no automatic coordination, save for a handful of novel breath-actuated devices. Patients unable to synchronise inhalation and actuation therefore often use these products with an add-on device – a spacer or valved holding chamber (VHC). In simple terms, these allow the MDI to be actuated into an enclosed dead volume, from which the patient then inhales.
Issues associated with co-ordination give rise to certain requirements for stop/start timed flow control that are unique to MDI testing in:
- DDU testing, where total test volume – typically 2 L in the US and 4 L in Europe – as well as a volumetric flow rate (28.3 L/min) is specified, so air flow/sampling must be synchronised with actuation and stop after a specific time.
- APSD measurements for MDIs with a VHC11 which include testing with a time delay of two seconds (longer delays may also be applied) between actuation and the onset of sampling to determine the effect of unco-ordinated product use. This quantifies changes in the APSD of the aerosol prior to inhalation due to, for example, aerosol expansion, particle impaction, settling and electrostatic deposition.12,13
In these applications a fast-acting, timer-controlled solenoid valve, such as the BAC™ 2100 Breath Actuation Controller (Copley Scientific, UK), which provides near instantaneous (<25 ms) “stop/start” flow control, has a valuable role to play in reducing variability. This valve can also be used for the automatic actuation of breath actuated MDIs. As with the TPK 2100, all test parameters are automatically recorded.
Flow Profile Control – Moving Towards Better IVIVCs
The flow control associated with the compendial methods for APSD measurement centres on the application of sharp, square-wave profiles – near instantaneous on/off action, in combination with constant flow. Though essential for cascade impaction these are, of course, quite unlike the inhalation profiles applied by patients. Studies show that “how” you measure, the rate at which flow ramps up during measurement, for example, influences “what” you measure, the value of APSD metrics.14,15 Measuring the effects of different profiles, flow rates and breathing techniques to scope performance fully and assess variability from patient physiology or technique is therefore increasingly common, within a quality by design (QbD) environment, and to minimise reliance on in vivo testing; the associated test set-ups (Figure 2b) bring new flow control challenges.
“While flow control requires appropriate knowledge and understanding, many discrete elements of testing are simply repetitive, laborious and/or time-consuming and are easily automated, in turn reducing variability…”
Breathing simulators are now a core element of the flow control toolkit for inhaler testing. These allow analysts not only to reproducibly generate the standard tidal breathing profiles (neonate, infant, child and adult) specified for DDU testing for nebulisers and MDIs with add-on devices,6,7,11 but also to apply patient-derived forced inhalation profiles for enhanced clinical realism in MDI and DPI testing. Breathing profiles can be modified by adjusting wave pattern, tidal volume and the number, duration and timing of each breathing cycle. More powerful simulators such as the BRS 3100 (Copley Scientific, UK) are especially useful for studying the impact of ramp rate: the rate at which flow accelerates from zero to peak flow. This parameter is particularly relevant to DPIs because of the correlation between performance and the inspiratory strength of the patient, which drives aerosolisation and dispersion of the powder formulation. The recent introduction of advanced flow control solutions for automatic air flow balancing – a designated, automated compressed air flow controller, in combination with a suitable compressor and appropriately designed manifold – make it significantly easier to achieve the more complex flow control, which is associated with more clinically representative test set-ups, for all OIPs.
SEMI-AUTOMATION
While flow control requires appropriate knowledge and understanding, many discrete elements of testing are simply repetitive, laborious and/or time-consuming and are easily automated, in turn reducing variability. A prime example is MDI actuation, where automation enables the precise, consistent control of variables such as the shaking profile, actuation force and speed, angle of fire and the length of pauses between shaking and firing, simultaneously eliminating a low-value task for the analyst and the risk of repetitive strain injury (RSI). Suspension formulations, in particular, can be sensitive to these parameters, due to the potential for phase separation, so automated methods can markedly improve reproducibility.
However, it is drug recovery, the most manually intensive part of APSD measurement, that offers most scope for semi-automation of this type, to reduce costs, boost productivity, improve data integrity and reduce the risk of exposure to materials hazardous to health. This is particularly true in QC testing and or where standard compendial methods are being used, since labour-saving devices and automation solutions are especially well developed for the most routinely used pieces of equipment.
Key decisions associated with the drug recovery process include:

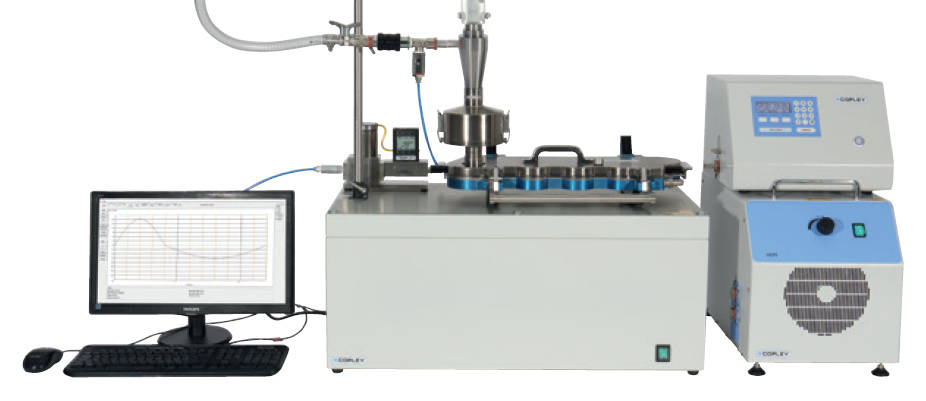
Figure 5: The NGI Assistant is a turn-key solution for automation of the labourintensive process of sample preparation.
- How much solvent volume to use since, an excess can compromise HPLC accuracy, while too little may impact dissolution efficiency.
- The optimal dissolution procedure – contact time, degree of agitation and any requirement for the use of ultrasonics.
- Which equipment to use to minimise sample degradation via sample loss to vessel walls, the absorption of API from solution and solvent evaporation.
The NGI Assistant (Copley Scientific, UK) is a turn-key solution that provides automation from the point of dissolution of the collected samples through to the presentation of sample solutions for HPLC analysis (Figure 5). Up to three complete cup trays, or a combination of cup trays and up to three EP/USP induction ports or three pre-separators can be simultaneously accommodated. The system automatically dispenses solvent to each cup (or accessory), applies a gentle rocking action to dissolve the drug into solution and produces both a primary and back-up sample, in industry-standard HPLC vials, ready for analysis. The latest versions offer even shorter cycle times than their predecessors, freeing up significant quantities of analyst time and effort for greater value-added work.
While requiring appreciable capital investment, compared with full automation these systems provide a lower cost, lower risk solution with a sound return. As a result, in recent years, companies have taken a more modular approach to automation, focusing on where the greatest improvements can be made, rather than trying to automate the entire process end-to-end. This degree of automation simultaneously eliminates multiple sources of variability, substantially reducing analyst fatigue and stress, the risk of inadvertent errors, and associated requirements for training. As a result, both reproducibility and productivity are significantly enhanced.
Alternatively, simple devices can be used to automate discrete, repetitive rinsing activities in both APSD measurement and DDU testing. The dose uniformity sampling apparatus (DUSA) shaker, for example, automates the internal rinsing of DUSA collection tubes while the sample preparation unit model SPU 2000 performs a similar function for the EP/USP induction port and NGI pre-separator. These devices ensure the consistent wetting of internal surfaces and the controlled application of a defined agitation pattern, thereby offering complete, reproducible dissolution, a minimised risk of RSI and increased productivity. Low cost and easy to validate, they can play a major role in alleviating the operator-related variability associated with drug recovery.
CONCLUSION
The defining attractions of cascade impaction as a technique for OIP characterisation are widely recognised, but so too are its limitations. Addressing the sources of variability that can compromise measurements is essential for the generation of APSD data that optimally support the development and manufacture of OIPs and there is a wide range of technology that can help, particularly in the areas of air flow control and semi-automation. Choosing ancillaries and labour-saving devices that are well-matched to workflow requirements is a cost-effective way of minimising OOS results, and optimising data integrity.
REFERENCES
- “Aerosols, Nasal Sprays, Metered Dose Inhalers and Dry Powder Inhalers”. US Pharmacopeia, Chapter 601.
- “Aerodynamic Assessment of Fine Particles”. European Pharmacopoeia, Chapter 2.9.18.
- Zhang Y, “In vivo – in vitro comparison of deposition in three mouth throat models with Qvar® and Turbuhaler® inhalers”. J Aerosol Med, 2007, Vol 20(3), pp 227–235.
- Weers JG et al, “In vitro-In vivo correlations observed with Indacaterol-based formulations delivered with the Breezhaler®”. J Aerosol Med Pulm Drug Deliv, 2015, Vol 28(4), pp 268–280.92
- Mitchell JP, “The Good Cascade Impactor Practice (GCIP) Concept: A systematic approach to risk management of erroneous measurements in the assessment of inhaler emitted aerosol aerodynamic particle size distributions (APSDs).” Inhalation, April 2014.
- “Products for Nebulization”. US Pharmacopeia, Chapter 1601.
- “Preparations for Nebulisation”. European Pharmacopoeia, Chapter 2.9.44.
- Huynh BK et al, “Evaluating pharmaceutical aerosol deposition in electrostatically charged plastic mouth-throat models”. RDD Europe, 2017.
- “Draft Guidance for Industry: Metered Dose Inhaler (MDI) and Dry Powder Inhaler (DPI) Products – Quality Considerations”. US FDA, April 2018.
- Copley M, McDonald J, “Cascade Impactor Flow Control”. Inhalation, Feb 2009.
- “Spacers and Valved Holding Chambers used with Inhalation Aerosols – Characterization Tests”. US Pharmacopeia, Chapter 1602.
- Mitchell JP, Coppolo DP, Nagel MW, “Electrostatics and inhaled medications: Influence on delivery via pressurized metered-dose inhalers and add-on devices”. Respir Care, 2007, Vol 52(3), pp 283–300.
- Anhøj J, Bisgaard H, Lipworth BJ, “Effect of electrostatic charge in plastic spacers on the lung deliveryof HFA-salbutamol in children”. Br J Clin Pharmacol, 1999,Vol 47(3), pp 333–336.
- Chavan V, Dalby R, “Effect of rise in simulated inspiratory flow rate and carrier particle size on powder emptying from dry powder inhalers”. AAPS PharmSci, 2000,Vol 2(2), E10.
- Stein R, “CI testing of passive DPIs: Best practices and relevance to patient use – an IPAC-RS viewpoint”. RDD 2018.
Previous article
MANUFACTURING DPIS: AN ENGINEERING PERSPECTIVENext article
PIPELINE TRENDS AND CHALLENGES IN PULMONARY DELIVERY