
To Issue 192
Citation: Segens A, Huedepohl R, “The Overlooked Sustainability Lever: Human Factors in Drug Delivery”, ONdrugDelivery, Issue 192 (Oct/Nov 2026), pp 38–43.
Adrian Segens and Robin Huedepohl consider the effects of device design choices on environmental impact, looking at how design decisions can be optimised to reduce drug or device wastage, improve benefits for patients and ultimately minimise carbon footprints.
Injectable therapies have been moving out of the clinic and into the home at pace for over a decade and the shift shows no sign of slowing. Biologics that once required administration by a healthcare professional are now supplied to patients for subcutaneous self-administration, and the growth of glucagon-like peptide-1 therapies has made combination products available to an unprecedented number of largely untrained users.
There is arguably an environmental benefit to this shift. At-home administration removes the need for journeys to the clinic, reduces clinical contact time and, where it improves disease control, avoids the frequency of flare-ups and hospital admissions. That argument depends on a condition that may seem obvious – the treatment must be delivered as intended, whether through patient compliance, treatment regimen adherence or correct use of the delivery device.
“EACH INSTANCE OF DEVICE MISUSE – WHETHER THAT BE A DOSE THAT IS STORED INCORRECTLY, NOT FULLY DELIVERED OR DISCARDED IN AN UNUSED DEVICE – ERODES THE ENVIRONMENTAL COST-BENEFIT TRADE-OFF BEHIND THE PRODUCTION OF THE DRUG, PRIMARY CONTAINER, DEVICE, PACKAGING, TRANSPORT AND STORAGE.”
Each instance of device misuse – whether that be a dose that is stored incorrectly, not fully delivered or discarded in an unused device – erodes the environmental cost-benefit trade-off behind the production of the drug, primary container, device, packaging, transport and storage. Misuse is not a user failure; it arises from interactions between the user, device (including its training offering, labelling and packaging) and use environment, and can represent opportunities to improve design.
Most of the work to address sustainability currently sits upstream of dose delivery – particularly around materials, manufacturing and supply-chain environmental impacts. For example, material selection, lightweighting, manufacturing efficiency, packaging reduction and end-of-life recovery are specified, measured and compared within engineering and lifecycle assessment (LCA) processes. A broader approach is to consider the overall treatment as the functional unit, bringing both the drug and delivery device within the scope of LCAs. Even with this wider scope, models tend to focus on residual drug losses.
An LCA by ApiJect modelled the remaining drug in the container after delivery but without consideration of doses lost due to device mishandling. This is a gap that needs to be addressed further. Human factors engineering is not only a safety discipline, but also a tool for understanding how much of a treatment’s footprint is spent on doses that never work.
“MATERIAL SELECTION AND REDUCTION REMAIN IMPORTANT SUSTAINABILITY LEVERS, BUT THEIR EFFECT MUST BE CONSIDERED ALONGSIDE THE LOSSES THAT OCCUR WHEN TREATMENTS ARE NOT SUCCESSFULLY ADMINISTERED.”
Material selection and reduction remain important sustainability levers, but their effect must be considered alongside the losses that occur when treatments are not successfully administered. The comparison that follows illustrates where design efforts can have the greatest overall benefit, rather than ranking one type of improvement over another.
HOW MUCH CARBON CAN A DEVICE DESIGN ACTUALLY SAVE?
The first question to ask is not actually “How much carbon does a sustainable device design save?”, but “How much of the treatment footprint lies beyond the device?”. A published LCA of the Prefilled ApiJect Injector, a single-dose device that pairs a blow-fill-seal plastic container with a double-ended needle hub, placed around 29% of the lifecycle carbon footprint on the drug and 71% on the device, packaging and manufacturing.1
Two details qualify these figures. Firstly, the 29% rests on a normalised drug carbon intensity of 10 kg CO2 equivalents rather than a product-specific figure. Secondly, the drug-related share counts the residual volume left in the container, not the doses lost due to incorrect use.
The carbon footprint of a drug is neither negligible nor fixed. It rises with the carbon intensity of the API (such as low-yield synthesis routes and cold-chain storage requirements) and falls as the device and its container get heavier. Reducing the device’s environmental impact is a possibility, but it is a bounded one. Materials, mass and manufacturing changes act only on part of the carbon footprint that the device occupies. That part is 71% of the ApiJect total, so a 20% reduction in it lowers the total treatment footprint by 14.2%. When the drug accounts for a larger share of the carbon footprint, the same improvement delivers even less impact (Figure 1). However, a wasted unit affects the footprint of both the drug and device.
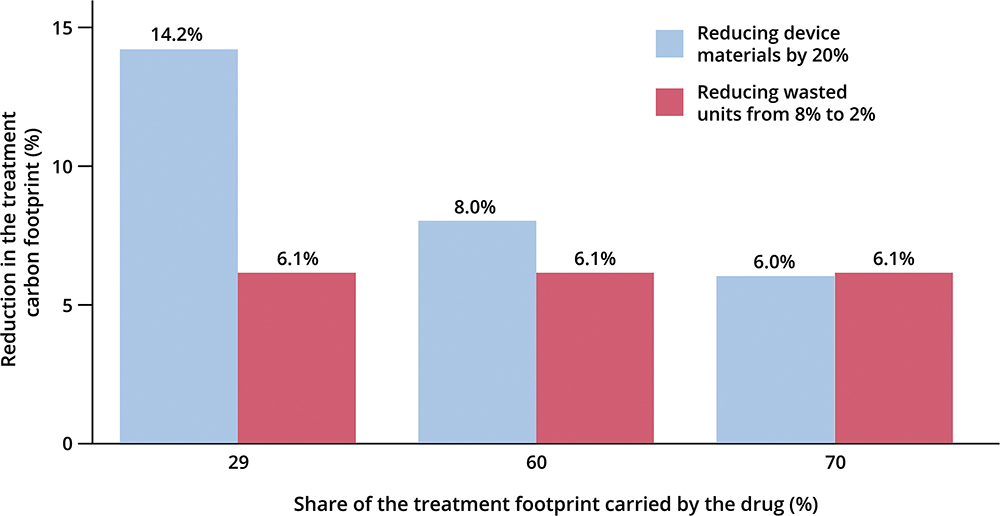
Figure 1: Impact of two improvement programmes on the carbon footprint split between drug and device, based on assumptions detailed in Table 1. As the carbon footprint of the drug increases, reducing device materials has less impact on the overall footprint. Minimising the number of wasted units reduces both drug and device losses. Reducing device materials and number of wasted units has equal impact when the drug carbon footprint is 70% of the total.1
Use-related losses are not bounded by the footprint of the device. A device with the same materials footprint but designed to reduce use-related failures may deliver more of its doses. Conversely, when a whole unit is lost without delivering a therapy, both drug and device are lost together, meaning that loss scales with the entire footprint rather than with part of it. Quantifying the environmental significance of these losses constitutes an important focus for future research, as current real-world data remains limited.
Therefore, headline device improvements to sustainability must be read against the drug footprint share. YpsoLoop (Ypsomed), launched in October 2025, estimates an 87% reduction in material-related CO2 emissions when compared with a conventional autoinjector, achieved through the use of bio-based and sustainable materials in a platform designed for disassembly and recycling.2 Material-related emissions are only one aspect of the device footprint, so the effect on the overall treatment footprint is a fraction of reduced emissions, and component recovery depends on devices being returned into a managed end-of-life pathway.
HOW MUCH DOES A WASTED DOSE ADD TO THE OVERALL CARBON FOOTPRINT?
The answer depends on the composition of the footprint rather than on which impact is counted.
A single-dose case is used here as the simplest, most conservative estimate of how a wasted dose affects an overall carbon footprint. At worst, when a whole-unit loss occurs – perhaps through incorrect storage, preparation or activation by the user – drug and device are lost together, so the whole carbon footprint is carried by a single dose.
Table 1 compares two assessments of the same product using different functional units: environmental impact per unit manufactured and environmental impact per dose successfully delivered. This distinction is consistent with those allowed by ISO 14044.3
| Factors assessed | Conventional assessment | Assessment including use-related loss |
Source |
| Drug share of carbon footprint | 29% | 29% | ApiJect LCA1 |
| Device, packaging and manufacturing share | 71% | 71% | ApiJect LCA1 |
| Functional unit | One unit manufactured | One dose successfully delivered | ISO 140443 |
| Whole-unit loss rate | Not modelled | 2% low case, 8% high case | Illustrative |
| Environmental impact per functional unit |
100% | 102.0% at a 2% loss rate, 108.7% at an 8% loss rate |
Calculated |
| Value of a 20% cut to the device materials | 14% of the total | 14% of the total | Calculated |
| Value of cutting whole-unit loss from 8% to 2% | Not visible | 6% of the total | Calculated |
Table 1: Two assessments of the same product, differing only in the functional unit. Illustrative values are chosen to show sensitivity, not to represent a specific product.
The conventional assessment – impact per unit manufactured – shows one environmental lever. Cutting the device share of the footprint by 20% is worth 14% of the total footprint. The second assessment reveals two levers: that same 14%, and a further 6% when cutting whole-unit loss from 8% to 2%. This second lever carries a little under half the impact of the first, which is not shown at all by a conventional assessment.
This is not to say that any single human factors intervention will deliver a reduction in a product’s carbon footprint. The environmental value of a design change ultimately depends on the loss that it addresses.
Many steps that do affect the device loss rate are already addressed through human factors considerations, such as storage before use, the preparation sequence, activation and, where applicable, completing a device return.
Partial losses cause different outcomes. If 10% of injections result in a quarter of the dose lost to a wet injection, the drug wasted is 0.7% of the total footprint, against 8.7% for an 8% whole-unit loss rate (more than ten times larger).
Not all losses are entirely use-related. Overfill and priming volumes are set by the formulation and the container. Cold-chain excursions occur during distribution and in pharmacy handling. Devices fail and doses expire unused. Moreover, from a human factors perspective, foreseeable use-related losses are understood as shortcomings in the design of the system, not failings of users. Design teams can influence these losses through changes to packaging, device design, storage guidance, return systems or service design.
WHERE DOES USE-RELATED LOSS OCCUR?
While human factors is typically associated with safe and effective use,4,5 it also influences sustainability outcomes. From a sustainability perspective, a key question is how user interactions can lead to the loss of drug, device hardware or recovery value. Selected device categories illustrate how these losses arise in different ways.
Autoinjectors, Pen Injectors and Prefilled Syringes
Across these device categories, the most costly events are whole-unit losses, where both drug and device are discarded together. Incorrect storage before use and accidental activation during preparation both consume the unit without delivering the therapy, and even over-priming a pen injector partially wastes drug.
Loss of drug during a wet injection – where the device is lifted before delivery is complete and drug escapes at the needle or leaks back from the injection site – also significantly affects the environmental impact (while its clinical impact is product specific). That impact grows as dose volumes rise. In response to this, the designs to test include packaging that presents components in the order of use, pre-prime locking, unambiguous dose progress and clear end-of-dose feedback. Similarly, a fixed multidose device specified for four doses but abandoned after two leaves its hardware carrying twice the environmental burden assumed by the per-dose assessment.
Disposable On-Body Devices
Disposable on-body devices carry more hardware per dose, often including electronics and a battery, so each unit loss costs more than a purely mechanical equivalent. Poor attachment can mean the dose is not delivered correctly, and removing the device early wastes the undelivered drug in the device or on the skin.
Digital and Connected Elements
Connected devices, apps and electronic instructions can reduce waste by improving dosing confidence, prompting returns and keeping hardware in service, but they are not automatically sustainable. Electronics, batteries, sensors and data infrastructure add environmental impact at a time when global e-waste is rising by around 2.6 million tonnes a year, with only about a fifth formally collected and recycled.6
The question is targeted – “Which waste mechanism does this digital element remove, and is the reduction in footprint larger than the environmental impact that the element adds?”. Misread status indicators may prompt a patient to discard a working unit, though how often this happens is not well documented. Adhesion, a clear wear-time signal and status indicators that distinguish a fault from a completed dose are all levers which may reduce avoidable losses.
DESIGN LEVERS ACROSS DEVICE CATEGORIES
Across all discussed device categories, the design levers are familiar. The sustainability lens asks, “Which lever affects the most environmentally significant part of the treatment system?”. Figure 2 maps each lever to the stage it acts on and the loss it may prevent. Table 2 sets out where the losses arise in each category.
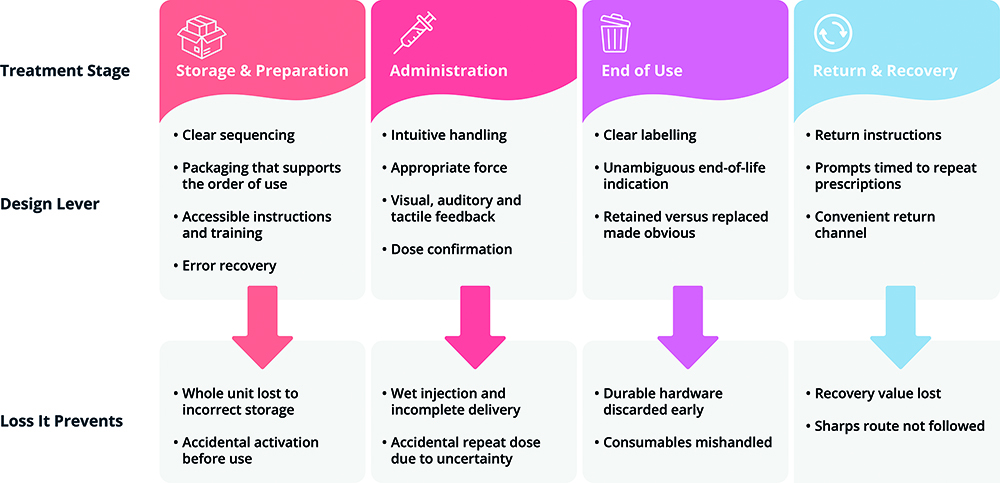
Figure 2: Design levers mapped to the treatment stage they act on and the loss that each may prevent (illustrative, not an exhaustive list).
| Device category | Storage and preparation | Administration | End of use and recovery |
| • Autoinjector • Pen injector • Prefilled syringe • Single-dose and multidose |
• Incorrect storage before use • Accidental activation during preparation • Over-priming a pen injector |
• Device lifted before delivery is complete, resulting in wet injection • Ambiguous end-of-dose feedback |
• Uncertainty over sharps handling • Part-used pen discarded with doses remaining • Device discarded before a return route is used, where one exists |
| • Disposable on-body device | • Poor skin preparation or attachment • Incorrect storage of the filled unit |
• Premature removal wastes the undelivered drug • A misread status indicator may prompt disposal of a working unit |
• Electronics and battery leave the recovery stream • Unit abandoned before the end of its intended use life |
| • Digital or connected element | • Set-up or pairing not completed | • Alerts ignored or misinterpreted • Untrusted dose record prompts an unnecessary replacement |
• Electronics enter general waste • App abandoned, so return prompts are never seen |
Table 2: Examples of use-related waste mechanisms by device category (not an exhaustive list).
ADHERENCE MAGNIFIES EFFECTS AT LARGER SCALES
The same principle applies at larger scales for non-adherence to chronic therapies. Non-adherence is a substantial field of study, with a large set of psychological and behavioural literature behind it. The difficulty is in isolating the device-attributable part rather than explaining the whole effect.
A treatment manufactured, distributed and dispensed but never used produces its full carbon footprint with no patient benefit. Adherence to long-term therapies for chronic illness in developed countries averages around 50%,7 and unused or wasted prescription medicines cost the NHS in England around £300 million per year.8
Non-adherence is influenced by many factors, including side effects, access to treatment and clinical support. However, some barriers are directly affected by device design, including needle anxiety, uncertainty that a dose has been successfully delivered, packaging and treatment routines that are difficult to integrate into daily life. When these barriers lead to treatment abandonment, the sustainability outcome is ultimately the same: resources are consumed without delivering the intended therapeutic benefit.
MAKING WASTE VISIBLE IN EXISTING HUMAN FACTORS WORK
The questions already asked under IEC 62366-1 and equivalent human factors guidance can be extended to sustainability with little additional effort.4,5 At each stage of the treatment journey, designers can ask:
- What could be wasted – drug, device hardware, packaging, consumables or recovery value?
- Which user behaviours could cause that loss and are they reasonably foreseeable?
- Which design features, instructions, training, packaging cues or services could reduce environmental impact?
- What evidence is needed to understand and quantify environmental impact?
Formative human factors studies already identify foreseeable use errors and the design causes behind them. The same output could answer a second question: “What environmental impact could each of those errors have?”.
Summative studies have then provided the evidence that design changes have reduced the occurrence of critical use-related errors in the intended context of use, providing data that could inform assumptions, modelling and scenarios within an LCA.
LOOKING AHEAD
Sustainability assessments routinely examine the environmental cost of producing and delivering therapies but have historically omitted the impact of lost therapies – when not used as intended. As injectable therapies continue to move into patients’ homes and hands, these losses become increasingly relevant to the environmental performance of the overall treatment system.
Human factors are usually discussed in terms of improving the safety and effectiveness of drug delivery devices, but many of the same use-related failures that these considerations prevent also reduce the loss of drug product, device hardware and recovery value.
Incorporating human factors considerations and data into environmental assessments, such as LCAs, has the potential to identify environmental impacts that are currently overlooked. Combining these two perspectives – manufacturing footprint and improved usability – could reveal the true environmental impact of a treatment system and where improvements can be made.
REFERENCES
- Eckelman MJ, Litan R, “Life-Cycle Assessment of the Prefilled ApiJect Injector”. LCA, Jun 2024.
- “Ypsomed launches YpsoLoop as the first autoinjector platform designed for circularity”. Press Release, Ypsomed, Oct 2025.
- “Environmental Management – Life Cycle Assessment – Requirements and Guidelines”. International Organization for Standardization, 2006.
- “Medical Devices – Part 1: Application of Usability Engineering to Medical Devices”. International Electrotechnical Commission, 2015.
- “Applying Human Factors and Usability Engineering to Medical Devices”. Guidance for Industry and FDA Staff, US FDA, Feb 2016.
- Baldé CP et al, “The Global E-Waste Monitor 2024”. UNITAR and ITU, 2024.
- Sabaté E, “Adherence to Long-Term Therapies: Evidence for Action” (Sabaté E, ed). WHO, 2003.
- Trueman P et al, “Evaluation of the scale, causes and costs of waste medicines”. York Health Economics Consortium and School of Pharmacy, University of London, 2010.